Symmetrical Triangle Breakdown Trading Pattern
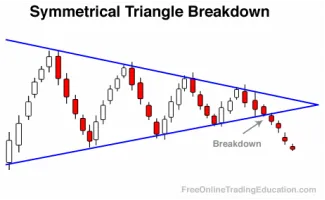
Symmetrical Triangle Breakdown Definition:
A Symmetrical Triangle Breakdown pattern is identified by the distinct shape created by two converging trendlines symmetrical in nature. The pattern is formed by two trendlines that connect a series of sequentially higher swing/pivot lows and a series of sequentially lower swing/pivot highs. Price action is largely contained within the triangle formation and traders typically look for opportunities to sell short once the price breaks down below the lower trendline of the triangle.
Background:
Put another way, price action forms a series of lower swing/pivot highs and higher swing/pivot lows in the context of an uptrend or a downtrend.
Symmetrical Triangles can breakout in either direction since this consolidating pattern has equal sentiment driving the formation. Within a downtrend, the possibility of a downside breakdown can increase due to the overall momentum of bearish sentiment supported by the potentially significant amount of overhead resistance in the chart.
Practical Use:
As with any patterns, Symmetrical Triangle breakdowns are carefully assessed by the technical analyst because of their ability produce subsequent downside or upside price action. Analysts will use other charting cues to place the odds in their favor of the downside price movement.
Get 6 (downloadable) trading tutorials emailed to you right now--FREE.

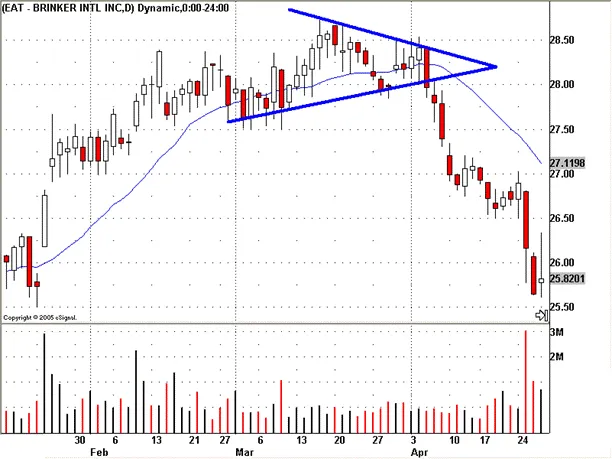
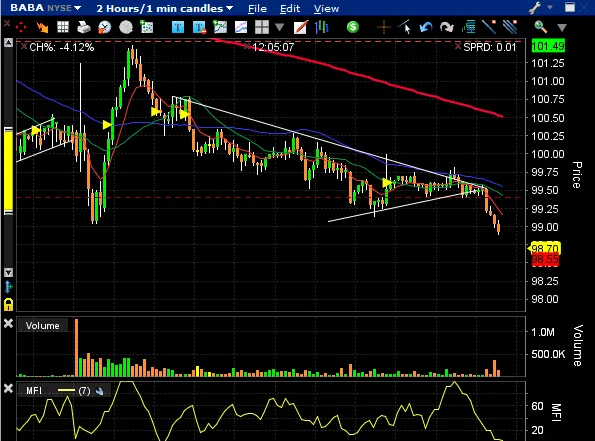
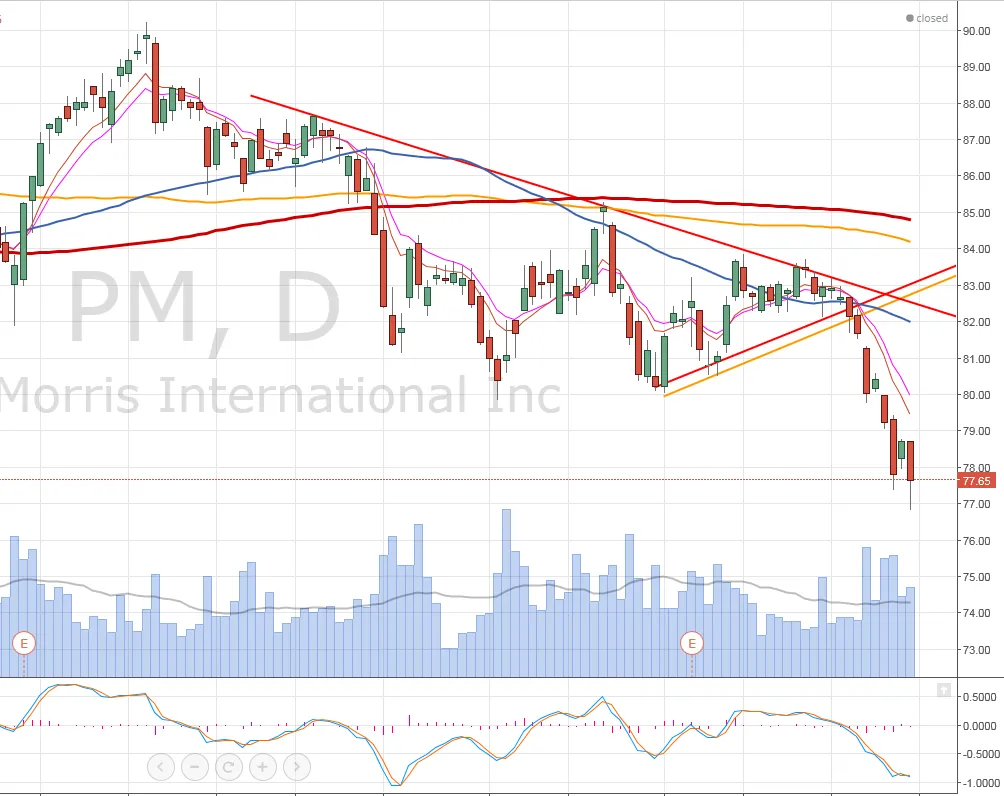
Real-life Chart Examples