
Ascending Triangle Trading Pattern
Summary:
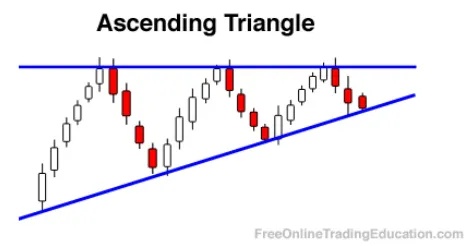
Ascending Triangle Definition:
An Ascending Triangle is a bullish chart pattern that consists of two trendlines: 1) a horizontal trendline at a level of resistance defined with no fewer than two swing highs and 2) an upward slanting trendline connecting a series of higher swing or pivot lows.
Background:
The pattern starts to form when price action traces an orderly price decline from a swing high, much like a pullback buy. The price then rallies up to the prior swing high and stalls. A second pullback occurs as overhead resistance is decreased and the stock then forms a higher swing low. This occurs over and over again until a series of equal swing highs and higher swing lows are formed.
The power of an Ascending Triangle can be greater after a powerful upside move due to the possible increase of underlying support.
Practical Use:
Technical analysts realize that Ascending Triangles can be stronger when the swing high that begins the pattern is also at an all time high due to the possible lack of future overhead resistance. Traders typically work into long positions when the price of the asset breaks above the upper resistance.
Ascending Triangle Trade Setup:
This is a bullish continuation or breakout pattern that often appears during an uptrend. It indicates potential continuation in the prevailing bullish direction after a period of consolidation.
Components:
Horizontal Resistance: This is a straight horizontal line drawn at the highs of the pattern, representing a level where selling pressure has prevented the price from advancing further.
Ascending Trendline: Formed by connecting the higher lows that the price makes. This upward sloping line represents increasing buying pressure as buyers are willing to purchase at higher prices.
Entry & Exit:
Entry: Traders often enter a long position when the price breaks out above the horizontal resistance, especially if the breakout is accompanied by an increase in volume.
Target Price: The projected move after the breakout is typically equivalent to the vertical height of the triangle (from the start of the ascending trendline to the horizontal resistance) added to the breakout point.
Stop Loss: A common strategy is to place a stop loss just below the last higher low inside the triangle or just below the ascending trendline.
Predictability & Factors to Consider:
Duration of the Triangle: Ascending triangles usually develop over a time frame of a few weeks to a few months. A longer formation period might lead to a more significant breakout move.
Volume: While the volume may decrease as the triangle forms, it should notably increase during the bullish breakout. This confirms the strength of the move.
Trend Confirmation: An ascending triangle is most reliable when it appears during an existing uptrend, confirming its role as a continuation pattern.
Trade Example:
Suppose a stock in an uptrend has been trading between $100 and $110 for several weeks. The price has tested the $110 resistance level multiple times, forming the horizontal line of the triangle, but has made progressively higher lows at $101, $103, and $105, forming the ascending trendline. If the stock breaks above the $110 resistance level with strong volume, a trader might expect a bullish continuation. Given the triangle's vertical height of $10 ($110-$100), the trader might set a target price of $120 ($110 + $10).
WARNING: As with any technical pattern, it's imperative to approach the ascending triangle with caution. Although it has shown predictability in certain scenarios, no pattern is foolproof. External factors and unexpected news can disrupt the anticipated trajectory of the stock's price. Always use multiple indicators and comprehensive research to make well-informed trading decisions. This is for educational purposes only. Always seek out a registered investment advisor before trading.
