Trading Academy Navigation
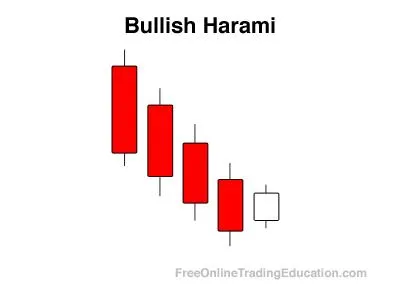
  • Bullish Harami Reversal Pattern

Definition:
The Bullish Harami is a two bar candlestick pattern that develops after a down leg. Each of the two candlesticks has an opposite color. After a sell-off in price, this pattern is formed when the real body of the second candlestick trades completely within the range of the real body of the previous candlestick.

Practical Use:
Technical analysts often use the Bullish Harami candlestick pattern as a signal to buy an asset. This is usually taken into context with another buy pattern for an added amount of confirmation.

Get 6 (downloadable) trading tutorials emailed to you right now--free.


Chart Example

About

Support

Social Media

© Copyright © 2007–2025 Grok Trade, LLC | All Rights Reserved 

Disclaimer: Educational Use Only
The content provided by Grok Trade, LLC—including courses, videos, training, and market analysis—is for educational purposes only and should not be considered financial, investment, tax, or legal advice. Grok Trade and its contributors are not registered investment advisers, broker-dealers, or financial planners. Trading involves risk of loss, including the potential for total loss of capital. Past performance does not guarantee future results, and hypothetical or simulated outcomes have limitations. Examples are for illustration only. You are solely responsible for your trading and investment decisions. Grok Trade makes no guarantees regarding accuracy or completeness and disclaims liability for any losses incurred from reliance on our content. Always consult a licensed financial professional before making financial decisions. Use of this site means you accept these terms.