Trading Academy Navigation
  • Western Bar Chart

Definition:
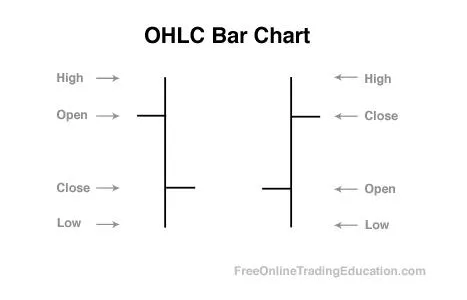
Bar Charts are often referred to as 'Western Bar' or 'OHLC' charts. This acronym stands for Open, High, Low and Close chart. Data is plotted on the chart for the open, high, low and close of each period represented by the time frame. The top of the bar is the high, the bottom the low, left side hash mark is the open and the right side hash mark is the close. 

Practical Use: Technical analysts use Western Bar Charts to better determine the price action for each bar and to clean up the "noise" of candlestick charts while still getting the requisite data above and beyond what a line graph can provide.

Get 6 (downloadable) trading tutorials emailed to you right now--free.


Western Bar Chart - LIVE Example

About

Support

Social Media

© Copyright © 2007–2025 Grok Trade, LLC | All Rights Reserved 

Disclaimer: Educational Use Only
The content provided by Grok Trade, LLC—including courses, videos, training, and market analysis—is for educational purposes only and should not be considered financial, investment, tax, or legal advice. Grok Trade and its contributors are not registered investment advisers, broker-dealers, or financial planners. Trading involves risk of loss, including the potential for total loss of capital. Past performance does not guarantee future results, and hypothetical or simulated outcomes have limitations. Examples are for illustration only. You are solely responsible for your trading and investment decisions. Grok Trade makes no guarantees regarding accuracy or completeness and disclaims liability for any losses incurred from reliance on our content. Always consult a licensed financial professional before making financial decisions. Use of this site means you accept these terms.