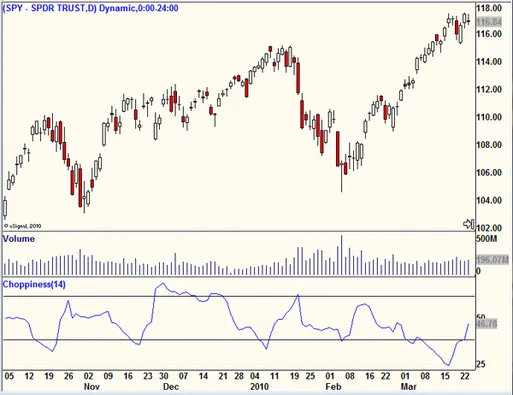
CI - The Choppiness Index
Charts by TRADINGVIEW

CI Choppiness Definition:
The Choppiness Index (CI) is a function of price direction and measures the direction or trend of price action. Price action that is trending well has a lower Choppiness Index number and price action not trending tends to have higher CI numbers.
Background:
The Choppiness Index ranges between 1 and 100. Again, the higher the index reading the "choppier" the price action is; the lower the index reading the better the chance that price is in an established trend.
The CI has an inverse association to price. The CI considers a trend broken when index reading is below the lower line and pivots. The CI is developed based on computerized fractal geometry. Traders tend to consider a CI value above 61.8 as high. A CI value below 38.2 is considered low indicating that price is in a trend.
The CI is much like the ADX (also designed to evaluate the strength of a current trend and to determine whether a market is trending or moving sideways). E.W. Dreiss introduced the CI and believes his indicator is superior because it may help a trader stay in a trending market and out of whipsaw prone times in volatile price action periods.
Practical Use:
Traders tend to use the CI as a sell indicator. One of the more crucial times of trading is when to exit a trade. When the CI is low signaling a healthy trend, traders will read a pivot, normally below 38.2, as a signal to exit the trade—especially if the CI reading rises above 38.2. This is often times considered the end of the current trend.
The Choppiness Indicator can provide the technical analyst with both entry and exit signals. These signals are typically the most meaningful when the price and volume of the chart being analyzed have also set up a bullish or bearish pattern. Using the Choppiness Index for additional confirmation of what has already been "read" in the chart can be a powerful addition to the assessment tools used by a technical analyst.
