Trading Academy Navigation
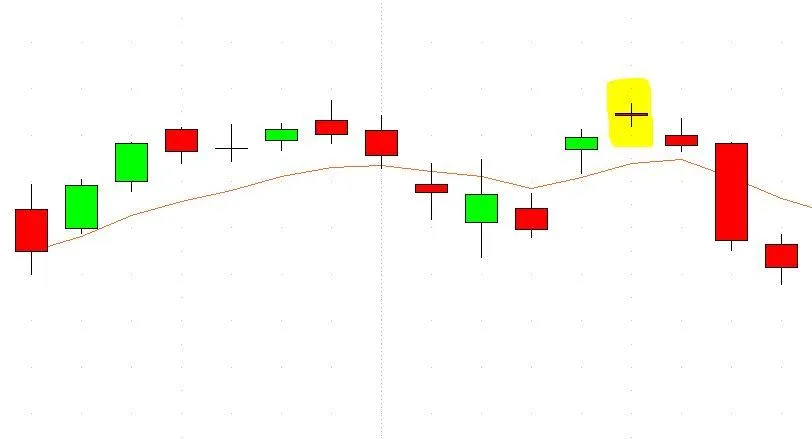
  • Doji Reversal Candle
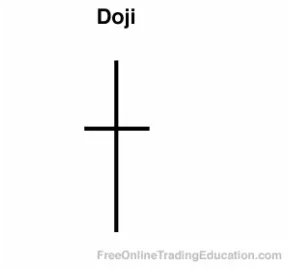
Doji Definition:
A Doji candlestick is formed when the open and close price of a bar is equal or nearly equal.

Background:
Upper and lower shadows can vary in length and the Doji indicates that there was indecision on price between buyers and sellers during the given timeframe of the candlestick.


Practical Use:
Technical analysts will watch for Doji candlesticks and often use them as buying or selling signals when in context of another chart pattern. In addition, analysts will use them for timing when to avoid buying or selling an asset.

Get 6 (downloadable) trading tutorials emailed to you right now--free.


Chart Example

About

Support

Social Media

© Copyright © 2007–2025 Grok Trade, LLC | All Rights Reserved 

Disclaimer: Educational Use Only
The content provided by Grok Trade, LLC—including courses, videos, training, and market analysis—is for educational purposes only and should not be considered financial, investment, tax, or legal advice. Grok Trade and its contributors are not registered investment advisers, broker-dealers, or financial planners. Trading involves risk of loss, including the potential for total loss of capital. Past performance does not guarantee future results, and hypothetical or simulated outcomes have limitations. Examples are for illustration only. You are solely responsible for your trading and investment decisions. Grok Trade makes no guarantees regarding accuracy or completeness and disclaims liability for any losses incurred from reliance on our content. Always consult a licensed financial professional before making financial decisions. Use of this site means you accept these terms.