
Follow Us!
Stochastic
Charts by TRADINGVIEW
Stochastic Definition:
The Stochastic is a momentum oscillator that can be useful in identifying overbought and oversold conditions. The stochastic compares a chart’s close to the high-low range over a certain period of time, usually 14 bars, and has a mathematically identical result when plotted on a chart to the "Williams %R" (or "%R") indicator. The difference between them is that the Stochastic indicator is plotted from 0 to 100 and the Williams %R is plotted from 0 to -100. The Stochastic %K line plots the relationship between the current closing value to the High and Low range over the last X number of bars. If the close is exactly at the highest point in the high/low range, the indicator will be at its maximum value. If the close is at its lowest point in the range, the indicator will be at its minimum value. The %D line is simply a moving average of the %K line (default is a 3-period SMA).
Background:
Typically, the best Stochastic signals occur when the price and volume of the chart being analyzed has also set up a bullish or bearish pattern. Using the Stochastic for additional confirmation of what has already been "read" in the chart can be a powerful addition to the assessment tools used by a technical analyst.
Practical Use:
Traders typically use this oscillator by watching for extreme line crossovers. For example, in an up swing, prices tend to close near the highs and in a down swing prices tend to close near the lows. Reversal signals occur when the %K line crosses the "%D" line.

Get 6 trading tutorials emailed to you: Click here
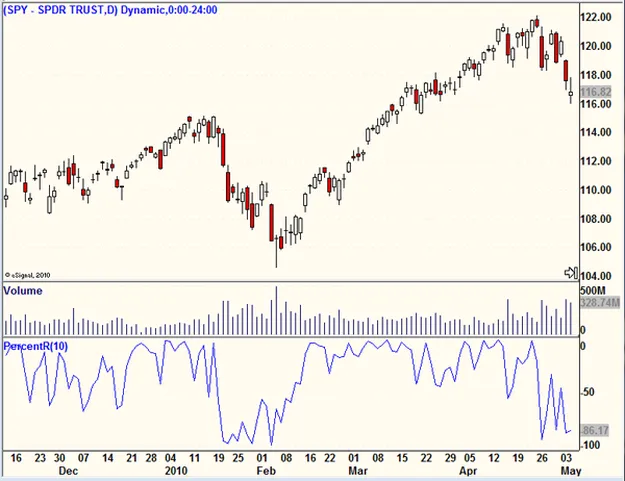
Stochastic Active Chart Example
Charts by TRADINGVIEW