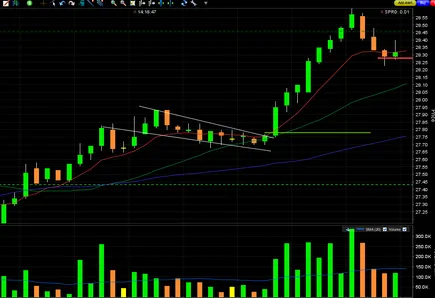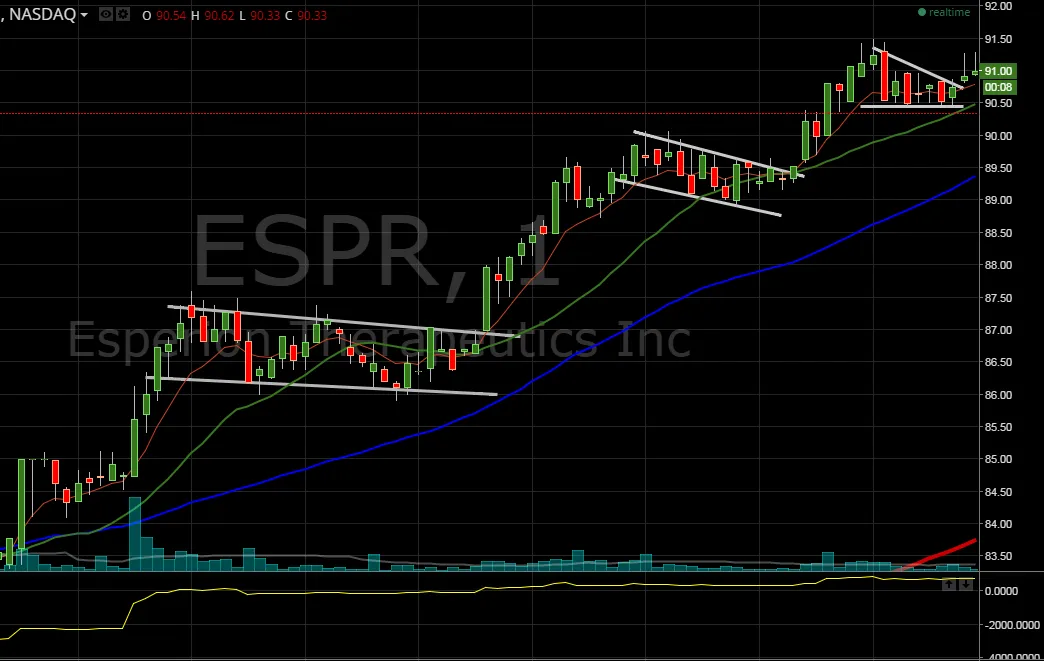
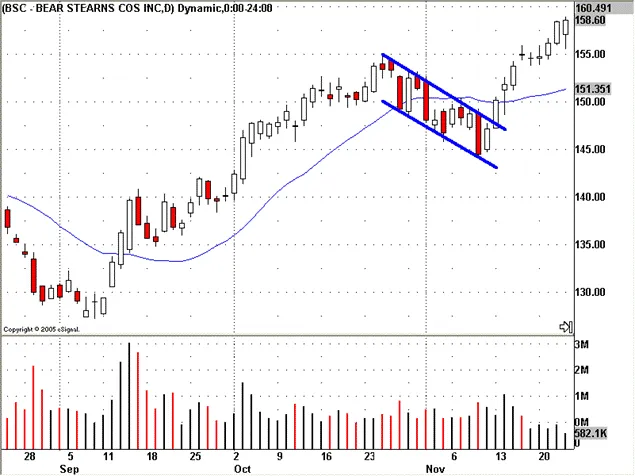
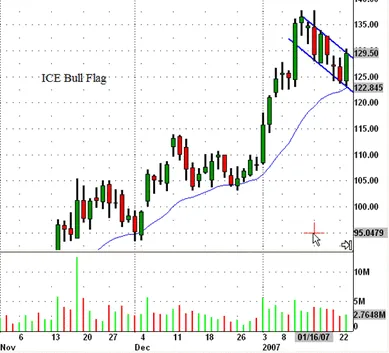
Bull Flag Trading Pattern
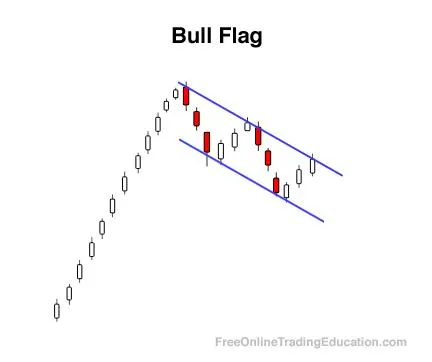
Bull Flag Pattern:
This is a continuation pattern that appears after a strong uptrend (i.e., up leg). It indicates potential continuation in the prevailing bullish direction after a brief consolidation.
Components:
Flag Pole: A strong and nearly vertical uptrend which best occurs on high volume. This represents a strong buying momentum.
Flag: A consolidation phase that follows the flag pole. It's a rectangle pattern that slopes downward against the prevailing trend. It's generally characterized by dropping volumes.
Entry & Exit:
Entry: Traders often enter a long position once the price breaks out of the flag pattern to the upside, especially if accompanied by an increase in volume.
Target Price: The projected continuation (or target price) is often equivalent to the length of the flag pole added to the breakout point.
Stop Loss: A common strategy is to place a stop loss just below the lowest point of the flag.
Predictability & Factors to Consider:
Duration of the Flag: Bull flags typically last between one (1) and three (3) weeks. Flags that last longer may not be as reliable in predicting the continuation.
Volume: The volume should decrease during the flag's formation and then notably increase during the breakout. This usually supports the continuation.
Trend Confirmation: The bull flag should be in alignment with the overall trend of the stock. If the stock's long-term trend is bullish, the bull flag is seen as a more reliable continuation pattern.
Trade Example:Imagine a stock that's been on a strong upward trend and has recently climbed from $50 to $70 in a week, forming the flag pole. After this surge, it consolidates in a downward sloping rectangle pattern between $65 and $68 for a week and a half. If the stock breaks above the rectangle pattern (the flag) on high volume, especially if it moves above $68 with conviction, a trader might anticipate a continuation of the bull trend. Given the flag pole's height of $20, a trader might set a target of $88 ($68 + $20).
WARNING: It's important to know that while patterns like the bull flag have shown predictability in some contexts, no pattern or indicator is foolproof.
Other factors, such as broader market conditions, news, and earnings reports, can influence a stock's price and make it diverge from the anticipated movement based on technical analysis. As always, using multiple indicators and considering the broader context is vital for better decision-making.
Definition:
A Bull Flag is a price action within the context of an uptrend that produces an orderly price decline consisting of a narrow trend range comprised of lower swing/pivot highs and lower swing/pivot lows.
Background:
The success of a Bull Flag can be greater after a significant upside move due to the possible increase of underlying support.
Bull Flags can be stronger when the swing high that begins the pattern is also an all time high due to the possible lack of future overhead resistance.
Practical Use:
Traders interested in gaining additional confirmation by watching the sentiment read of a chart will often seek out Bull Flag patterns due to their ability to “prove” the lack of selling interest during the timeframe in question.

Get 6 (downloadable) trading tutorials emailed to you right now--FREE.