
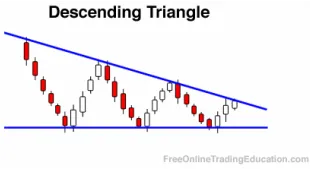
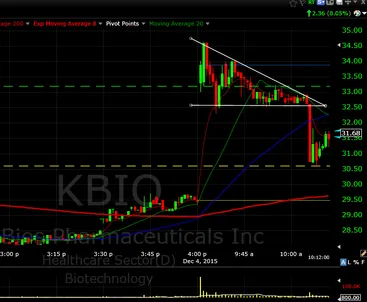
Descending Triangle Trading Pattern
Definition:
A Descending Triangle is a bearish chart pattern that consists of two trendlines: 1) a horizontal trendline at a level of support defined with no fewer than two swing lows and 2) a downward slanting trendline connecting a series of lower swing or pivot highs.
Background:
The pattern starts to form when price action traces an orderly price rise from a swing low much like a pullback sell. The price then declines down to the prior swing low and stalls. A second rally occurs as underling support is decreased and the stock then forms a lower swing high. This occurs over and over again until a series of equal swing lows and lower swing highs are formed.
The power of a Descending Triangle can be greater after a powerful downside move due to the possible decrease of overhead resistance.
Practical Use:
Technical analysts realize that Descending Triangles can be stronger when the swing low that begins the pattern is also an all time low due to the possible lack of future underlying support. Traders typically work into short positions when the price of the asset breaks below the bottom support.
Descending Triangle Trade Setup:
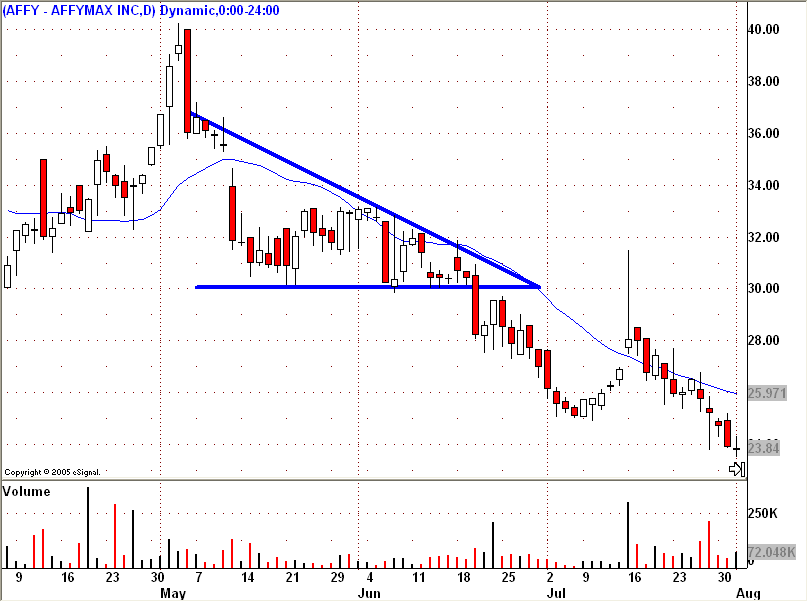
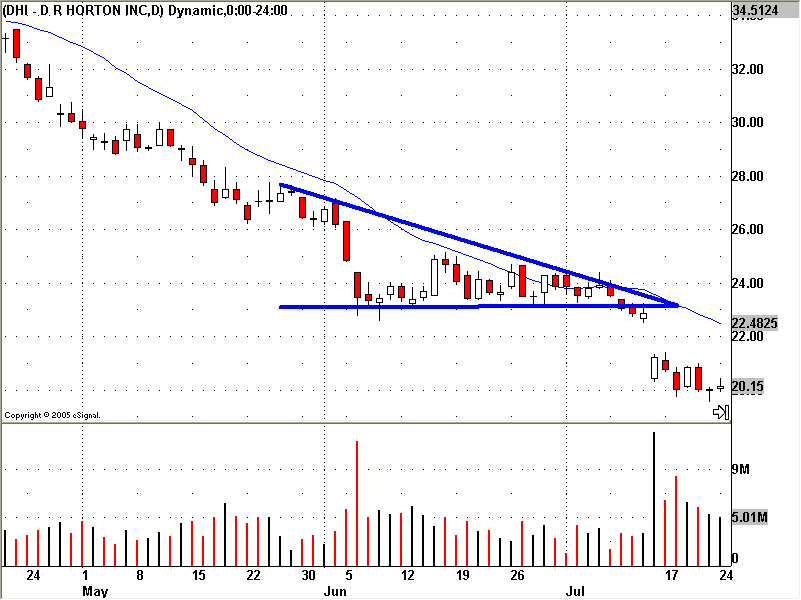
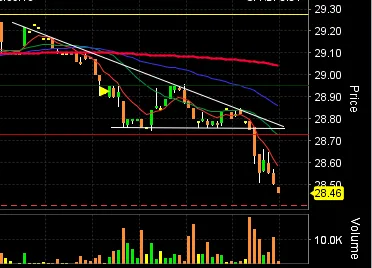
This is a bearish continuation or breakout pattern that often appears during a downtrend. It indicates potential continuation in the prevailing bearish direction after a period of consolidation.
Components:
Horizontal Support: This is a straight horizontal line drawn at the lows of the pattern, representing a level where buying pressure has prevented the price from dropping further.
Descending Trendline: Formed by connecting the lower highs that the price makes. This downward sloping line represents increasing selling pressure as sellers are more inclined to sell at lower prices.
Entry & Exit:
Entry: Traders often enter a short position when the price breaks down below the horizontal support, especially if this breakdown is accompanied by an increase in volume.
Target Price: The projected move after the breakdown is typically equivalent to the vertical height of the triangle (from the start of the descending trendline to the horizontal support) subtracted from the breakdown point.
Stop Loss: A common strategy is to place a stop loss just above the last lower high inside the triangle or just above the descending trendline
Predictability & Factors to Consider:
Duration of the Triangle: Descending triangles usually develop over a time frame of a few weeks to a few months. A longer formation period might lead to a more significant breakout move.
Volume: While the volume may decrease as the triangle forms, it should notably increase during the bearish breakdown. This confirms the strength of the move.
Trend Confirmation: A descending triangle is most reliable when it appears during an existing downtrend, confirming its role as a continuation pattern.
Trade Example:
Imagine a stock in a downtrend has been trading between $90 and $80 for several weeks. The price has tested the $80 support level multiple times, forming the horizontal line of the triangle, but has made progressively lower highs at $89, $87, and $85, forming the descending trendline. If the stock breaks below the $80 support level with significant volume, a trader might anticipate a bearish continuation. Given the triangle's vertical height of $10 ($90-$80), the trader might set a target price of $70 ($80 - $10).
WARNING: As with any technical pattern, it's essential to approach the descending triangle with caution. While it has displayed predictability in some scenarios, no pattern guarantees outcomes. External factors and unforeseen news can influence the stock's price movement. Always utilize multiple indicators and comprehensive research for informed trading decisions. This is for educational purposes only. Always consult a registered investment advisor before trading.
Get 6 (downloadable) trading tutorials emailed to you right now--FREE.
