
Follow Us!
Candlestick Chart
Definition:
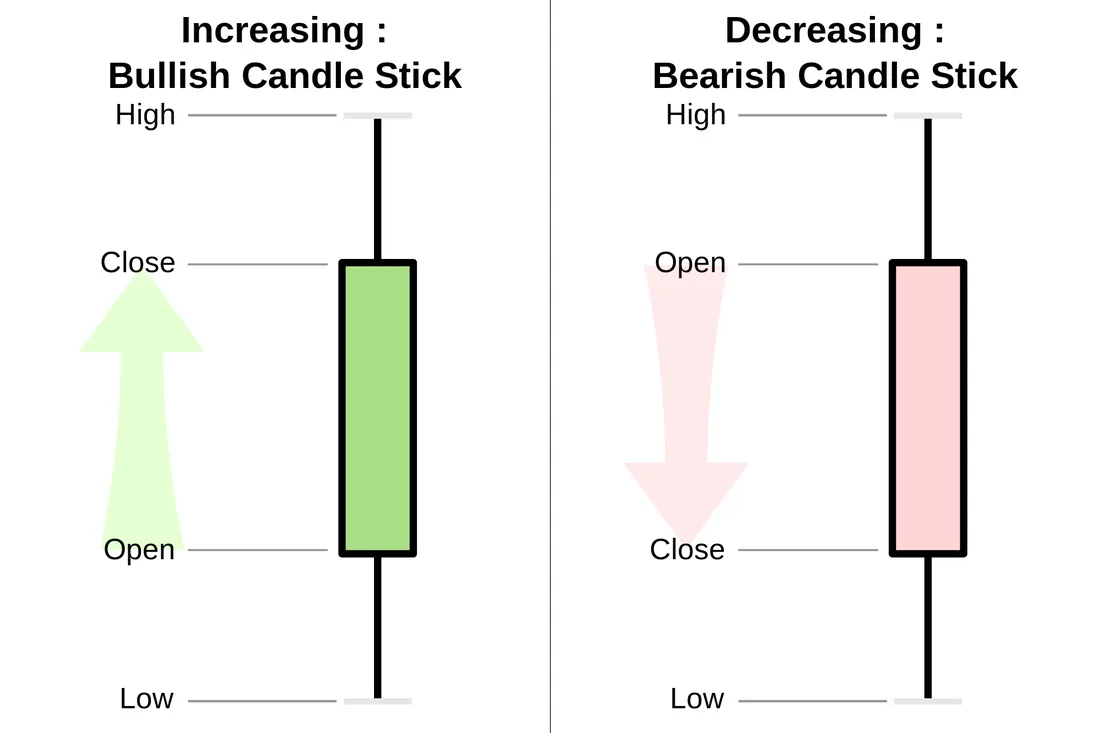
This style of bar chart is used as a color coded visual representation of prices where trades occurred during a specific time frame. Candlestick bars have the appearance of candlesticks and capture the same data as the traditional Open, High, Low and Close (OHLC) Western bars, but candlestick bars are color coded for easier visual interpretation.
Background: Candlestick charts have been used by the Japanese for technical analysis for over 100 years, long before the development of the bar chart by the West. A man named Homma Munehisa, who was a successful trader in the rice market, discovered that there was a link between prices, supply and demand. In addition, he understood that due to emotions, there was often a difference between "real" value and the price. Homma used candlestick chart analysis, in the 1700s, to help measure the emotions captured in price history and as a fairly reliable tool to predict future demand.
Each bar can represent any specified period of time, with the typical bar durations being 1, 3, 5, 15, 30 and 60 minute for shorter term, and daily, weekly and monthly for longer term analysis.
Candlestick analysis has been modified throughout the years and Steve Nison, CMT, introduced Candlestick charting to the West in the late 1980s.
Candlesticks, candlestick patterns (the combination of two or more individual bars) and chart patterns made up of many candlesticks can be helpful to technical analysts that study price action in order to forecast price into the future.
